영상에서 Histogram (히스토그램) 분석 및 Histogram 데이터를 이용하여 그래프를 그려 분석 할 수 있도록 WPF OpenCV 프로젝트에 구현하겠습니다.
지난 포스팅(#15, #16)에서 Otsu와 Adaptive Threshold를 다루면서 “히스토그램(Histogram)”이라는 단어를 스치듯 언급했었습니다. 기억나시나요?
“히스토그램에서 두 개의 산봉우리(Bimodal)가 생길 때, Otsu 알고리즘은 그 사이 골짜기를 찾아냅니다.” (Post #15 참조)
오늘은 바로 그 히스토그램을 직접 구현해 볼 차례입니다. 단순히 “어떤 색이 많다”를 넘어서, 영상의 명암 분포나 조명의 균일성을 파악하는 아주 중요한 기초 분석 도구입니다.
이번 편은 구현할 내용이 조금 있습니다. 흠… 하지만 우려할 만큼 엄청난 양이 아니니까 걱정은 저 너머에 두고, 시작해 보도록 하겠습니다.
Histogram
아주 간단히 말해서 “이미지 안에 픽셀 값이 몇 개씩 있는지 세어서 그래프로 그린 것”입니다.
- X축: 픽셀의 밝기 값 (0 ~ 255)
- Y축: 해당 밝기를 가진 픽셀의 개수 (Count)
이것을 분석하면 사진이 전체적으로 어두운지, 밝은지, 명암 대비(Contrast)가 뚜렷한지 한눈에 알 수 있습니다. OpenCV에서는 Cv2.CalcHist()라는 함수를 제공합니다.
구현 단계 정리
이번 기능은 단순히 알고리즘만 돌리는 게 아니라, 결과를 그래프로 보여줄 팝업 창(Window)까지 만들어야 해서 수정할 파일이 좀 많습니다.
- AlgorithmParameters.cs: 히스토그램 설정값(채널, 마스크 등) 정의
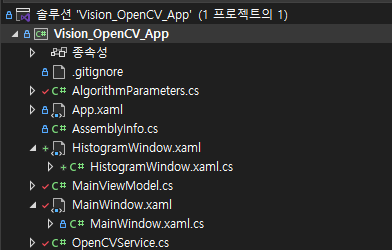
- HistogramWindow.xaml: 그래프를 보여줄 팝업 창 UI 생성
- HistogramWindow.xaml.cs: 데이터를 받아 직접 그래프를 그리는 로직 구현
- OpenCVService.cs:
Cv2.CalcHist로 데이터 분석 및 저장 - MainViewModel & View: 파라미터 연결 및 팝업 띄우기
자, 심호흡 한번 하고 하나씩 진행해 보도록 하죠.
Step 1: 파라미터 클래스 정의 (Model)
먼저 AlgorithmParameters.cs에 히스토그램 분석에 필요한 설정 값들을 정의합니다.
- Channel: 분석할 색상 채널 (Blue, Green, Red, Gray)
- HistSize (Bins): 몇 개의 구간으로 나눌 것인가? (보통 256개)
- Range: 분석할 밝기 범위 (0~256)
- MaskMode: 특정 영역(원, 절반 등)만 분석할지 여부
public class HistogramParams : AlgorithmParameters
{
    // 분석할 채널 (Blue/Green/Red/Gray)
    private ColorChannel _channel = ColorChannel.Blue_Gray;
    public ColorChannel Channel
    {
        get => _channel;
        set { if (_channel != value) { _channel = value; OnPropertyChanged(); } }
    }

    // 막대 개수 (보통 256)
    private int _histSize = 256;
    public int HistSize
    {
        get => _histSize;
        set
        {
            if (value < 1) value = 1;
            if (value > 256) value = 256;
            if (_histSize != value) { _histSize = value; OnPropertyChanged(); }
        }
    }

    // 분석 범위 (Min)
    private float _rangeMin = 0;
    public float RangeMin
    {
        get => _rangeMin;
        set { if (_rangeMin != value) { _rangeMin = value; OnPropertyChanged(); } }
    }

    // 분석 범위 (Max)
    private float _rangeMax = 256;
    public float RangeMax
    {
        get => _rangeMax;
        set { if (_rangeMax != value) { _rangeMax = value; OnPropertyChanged(); } }
    }

    // 특정 영역만 분석하기 위한 마스크 모드
    private HistogramMaskMode _maskMode = HistogramMaskMode.None;
    public HistogramMaskMode MaskMode
    {
        get => _maskMode;
        set { if (_maskMode != value) { _maskMode = value; OnPropertyChanged(); } }
    }

    // 콤보박스 바인딩용 리스트
    public List<ColorChannel> ChannelSource { get; } = Enum.GetValues(typeof(ColorChannel)).Cast<ColorChannel>().ToList();
    public List<HistogramMaskMode> MaskModeSource { get; } = Enum.GetValues(typeof(HistogramMaskMode)).Cast<HistogramMaskMode>().ToList();
}
Step 2 & 3: 그래프 팝업 창 만들기 (View & Logic)
분석된 데이터를 메인 화면에 띄우기엔 공간이 부족하니, 별도의 팝업 창(HistogramWindow)을 띄워서 보여주겠습니다.
HistogramWindow.xaml : 윈도우 생성
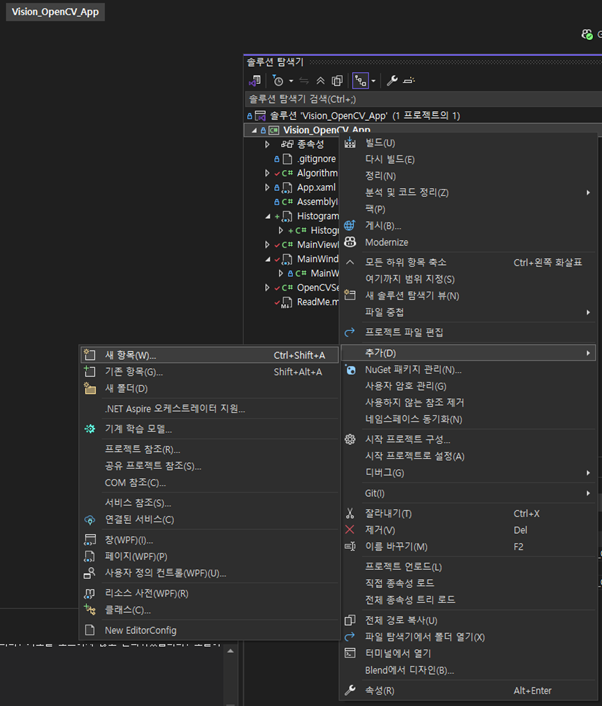
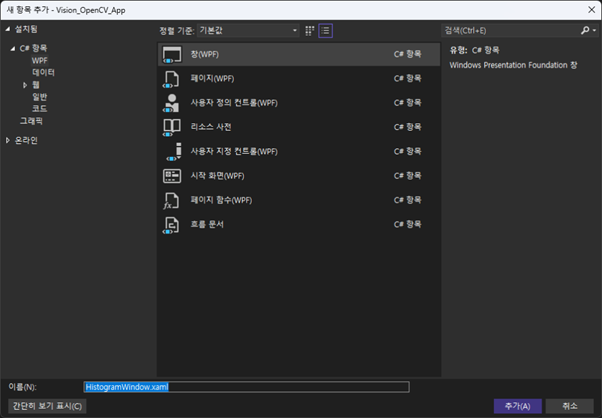
프로젝트 우클릭 > 추가 > 새 항목 > 창(WPF) > 이름: HistogramWindow.xaml 의 순서로 프로젝트 솔루션에 파일을 추가합니다. 아래의 그림을 참고해 주세요.
WPF의 강력한 점은 차트 라이브러리 없이도 Canvas와 Polyline만 있으면 멋진 그래프를 그릴 수 있다는 점입니다. 사실 그래프나 차트를 그리기를 제공하는 패키지들이 있긴 한데, 여기서는 기본 WPF 만으로 작성하도록 할게요. 아래 코드를 그래로 복사하여 사용하면 됩니다.
<Window x:Class="Vision_OpenCV_App.HistogramWindow"
        Title="Histogram Analysis" Height="450" Width="600"
        WindowStartupLocation="CenterScreen">
    <Grid Margin="10">
        <Grid.RowDefinitions>
            <RowDefinition Height="Auto"/>
            <RowDefinition Height="*"/>
        </Grid.RowDefinitions>

        <StackPanel Orientation="Horizontal" Grid.Row="0" Margin="0,0,0,10">
            <TextBlock Text="Histogram Details" FontSize="18" FontWeight="Bold"/>
            <TextBlock x:Name="TxtInfo" Text="" Margin="15,0,0,0" VerticalAlignment="Bottom" Foreground="Gray"/>
        </StackPanel>

        <Border Grid.Row="1" BorderBrush="Gray" BorderThickness="1" Background="White">
            <Canvas x:Name="GraphCanvas" ClipToBounds="True" SizeChanged="GraphCanvas_SizeChanged"/>
        </Border>
    </Grid>
</Window>
HistogramWindow.xaml.cs : 그래프 그리기 로직
여기가 이번 포스팅의 하이라이트입니다. 데이터를 받아서 Polyline으로 그래프를 그리는 DrawGraph 함수입니다. (코드가 조금 길지만, 주석을 보면 단순히 좌표를 찍어서 선을 잇는 원리입니다.)
새로 생성한 파일이라 아래에 전체 코드를 추가하였습니다. 중간 중간에 주석도 넣어 두었습니다. 어려운 부분은 딱히 보이지 않으니까 전체를 복사하여 붙여 넣어 주세요.
Key Point:
(현재 값 / 최대 값) * 높이공식을 사용해 어떤 크기의 데이터가 들어와도 화면 꽉 차게 정규화(Scaling)해서 그립니다.
using System;
using System.Linq;
using System.Windows;
using System.Windows.Controls;
using System.Windows.Media;
using System.Windows.Shapes;

namespace Vision_OpenCV_App
{
    /// <summary>
    /// HistogramWindow.xaml에 대한 상호 작용 논리
    /// </summary>
    public partial class HistogramWindow : Window
    {
        private float[] _data;
        private int _channel;

        public HistogramWindow(float[] data, int channel)
        {
            InitializeComponent();
            _data = data;
            _channel = channel;

            DrawGraph();
        }

        private void DrawGraph()
        {
            if (_data == null || _data.Length == 0) return;
            if (GraphCanvas.ActualWidth == 0 || GraphCanvas.ActualHeight == 0) return;

            GraphCanvas.Children.Clear();

            // 여백 설정 (축과 라벨 공간 확보)
            double margin = 40;
            double w = GraphCanvas.ActualWidth - margin * 2;
            double h = GraphCanvas.ActualHeight - margin * 2;

            double maxVal = _data.Max();
            if (maxVal == 0) maxVal = 1;

            // X축 간격
            double step = w / _data.Length;

            // 색상 결정
            Brush brush = Brushes.Gray;
            string chName = "Gray";
            if (_channel == 0)
            {
                brush = Brushes.Blue;
                chName = "Blue/Gray";
            }
            else if (_channel == 1)
            {
                brush = Brushes.Green;
                chName = "Green";
            }
            else if (_channel == 2)
            {
                brush = Brushes.Red;
                chName = "Red";
            }

            TxtInfo.Text = $"Channel: {chName} | Bins: {_data.Length} | Max Count: {maxVal:F0}";

            // Y축 그리기
            Line yAxis = new Line
            {
                X1 = margin, Y1 = margin,
                X2 = margin, Y2 = margin + h,
                Stroke = Brushes.Black,
                StrokeThickness = 1
            };
            GraphCanvas.Children.Add(yAxis);

            // X축 그리기
            Line xAxis = new Line
            {
                X1 = margin, Y1 = margin + h,
                X2 = margin + w, Y2 = margin + h,
                Stroke = Brushes.Black,
                StrokeThickness = 1
            };
            GraphCanvas.Children.Add(xAxis);

            // Draw poligon-Line
            Polyline polyline = new Polyline
            {
                Stroke = brush,
                StrokeThickness = 2,
                Fill = new SolidColorBrush(Color.FromArgb(50, ((SolidColorBrush)brush).Color.R,
                ((SolidColorBrush)brush).Color.G,
                ((SolidColorBrush)brush).Color.B))
            };

            // 데이터 포인트 추가
            // (0, 0)은 화면 좌상단이므로, Y값은 [margin + h]에서 빼줘야 위로 올라가는 그래프가 됨.
            // 시작점 (0,0) 추가 (채우기 효과를 위해)
            polyline.Points.Add(new Point(margin, margin + h));

            // Point 추가: (0, 높이) 부터 시작해서 닫힌 도형을 만들려면 Path를 써야 하지만, 간단히 선만 그림.
            for (int i = 0; i<_data.Length; i++)
            {
                double x = margin + (i * step);

                // Y 좌표는 위에서 아래로 증가하므로, h - 값으로 뒤집히도록 계산 필요.
                //double y = h - (_data[i] /maxVal * h);

                // 높이 계산: (현재 값 / 최대값) * 그래프 높이
                double y = (margin + h) - (_data[i] / maxVal * h);
                polyline.Points.Add(new Point(x, y));
            }

            // 끝점 (마지막X, 0) 추가 (채우기 효과를 위해)
            polyline.Points.Add(new Point(margin + w, margin + h));

            GraphCanvas.Children.Add(polyline);

            // 라벨 및 눈금 그리기
            // Y축 라벨 (최대 값)
            TextBlock maxLabel = new TextBlock
            {
                Text = maxVal.ToString("F0"),
                FontSize = 10,
                Foreground = Brushes.Black
            };
            // 텍스트 위치 잡기
            Canvas.SetLeft(maxLabel, 5);
            Canvas.SetTop(maxLabel, margin - 5);
            GraphCanvas.Children.Add(maxLabel);

            // Y축 라벨 (0)
            TextBlock zeroYLabel = new TextBlock
            {
                Text = "0",
                FontSize = 10,
                Foreground = Brushes.Black
            };
            Canvas.SetLeft(zeroYLabel, 25);
            Canvas.SetTop(zeroYLabel, margin + h - 5);
            GraphCanvas.Children.Add(zeroYLabel);

            // Y축 이름
            TextBlock yAxisTitle = new TextBlock
            {
                Text = "Count",
                FontSize = 12,
                FontWeight = FontWeights.Bold,
                RenderTransform = new RotateTransform(-90) // 세로로 회전
            };
            Canvas.SetLeft(yAxisTitle, 10);
            Canvas.SetTop(yAxisTitle, margin + h / 2 + 15);
            GraphCanvas.Children.Add(yAxisTitle);

            // X축 라벨 (시작 0)
            TextBlock startLabel = new TextBlock
            {
                Text = "0",
                FontSize = 10,
                Foreground = Brushes.Black
            };
            Canvas.SetLeft(startLabel, margin);
            Canvas.SetTop(startLabel, margin + h + 5);
            GraphCanvas.Children.Add(startLabel);

            // X축 라벨 (중간 128)
            TextBlock midLabel = new TextBlock
            {
                Text = "128",
                FontSize = 10,
                Foreground = Brushes.Black
            };
            Canvas.SetLeft(midLabel, margin + w / 2 - 10);
            Canvas.SetTop(midLabel, margin + h + 5);
            GraphCanvas.Children.Add(midLabel);

            // X축 라벨 (끝 255)
            TextBlock endLabel = new TextBlock
            {
                Text = "255",
                FontSize = 10,
                Foreground = Brushes.Black
            };
            Canvas.SetLeft(endLabel, margin + w - 15);
            Canvas.SetTop(endLabel, margin + h + 5);
            GraphCanvas.Children.Add(endLabel);

            // X축 이름
            TextBlock xAxisTitle = new TextBlock
            {
                Text = "Intensity Value",
                FontSize = 12,
                FontWeight = FontWeights.Bold
            };
            Canvas.SetLeft(xAxisTitle, margin + w / 2 - 40);
            Canvas.SetTop(xAxisTitle, margin + h + 20);
            GraphCanvas.Children.Add(xAxisTitle);

        }

        private void GraphCanvas_SizeChanged(object sender, SizeChangedEventArgs e)
        {
            DrawGraph();
        }
    }
}
Step 4: OpenCVService
이제 OpenCVService.cs에서 실제로 Cv2.CalcHist() 함수를 통해 히스토그램 처리를 구현합니다. 아래와 같이 OpenCVService.cs 파일 중에서 ProcessImageAsync() 함수 내에 switch 구문에 추가해 주세요.
// OpenCVService.cs -> ProcessImageAsync 내부

case "Histogram":
    if (parameters is HistogramParams histParams)
    {
        // 1. 채널 분리 (Split) - B, G, R 중 선택한 채널 가져오기
        Mat[] channels = Cv2.Split(_srcImage);
        Mat source = new Mat();
        int channelIdx = (int)histParams.Channel;
        // ... (채널 선택 예외처리 로직 생략) ...

        // 2. 마스크 생성 (Mask) - 원, 왼쪽, 오른쪽 등 특정 영역만 분석
        Mat mask = null;
        if (histParams.MaskMode != HistogramMaskMode.None)
        {
            mask = new Mat(source.Size(), MatType.CV_8UC1, Scalar.All(0));
            // ... (Circle, Rectangle 등으로 마스크 그리는 로직) ...
        }

        // 3. 히스토그램 계산 (핵심!)
        Mat hist = new Mat();
        int[] histSize = { histParams.HistSize }; // 보통 256
        Rangef[] ranges = { new Rangef(histParams.RangeMin, histParams.RangeMax) }; // 0~256

        // [API] Cv2.CalcHist(원본영상, 채널, 마스크, 결과저장소, 차원, 구간수, 범위)
        Cv2.CalcHist(new[] { source }, new[] { 0 }, mask, hist, 1, histSize, ranges);

        // 4. 데이터 저장 (팝업창 전송용)
        float[] rawData = new float[histParams.HistSize];
        hist.GetArray(out rawData);
        LastHistogramData = rawData;      // 프로퍼티에 저장
        LastHistogramChannel = channelIdx;

        // 5. 결과 이미지에 그래프 미리보기 그리기 (옵션)
        // ... (미리보기용 선 그리기 로직 생략) ...
    }
    break;
Step 5: ViewModel 및 View 연결
마지막으로 Step1 ~ Step4 까지 진행하였던 내용들을 UI(View)와 연결하도록 하겠습니다.
- MainViewModel.cs:
- MainViewModel 생성자 함수에 Histogram 항목을 추가합니다. 그리고 사용자가 Histogram을 선택하였을 때 CreateParametersForAlgorithm() 함수에서 HistogramParams 객체를 생성하도록 코드를 추가합니다.
ApplyAlgorithm함수 마지막에 “알고리즘이 Histogram이면 팝업창을 띄워라“라는 로직을 추가합니다.HistogramWindow객체를 생성할 때 Service에 저장해둔LastHistogramData를 넘겨줍니다.
- MainWindow.xaml:
DataTemplate을 추가하여 히스토그램 파라미터(슬라이더, 콤보박스)가 화면에 보이도록 합니다. <Window.Resource> </Window.Resource> 사이에 Histogram DataTemplate 를 추가합니다.
//MainViewModel.cs

// MainViewModel 생성자 함수에 Histogram 추가
public MainViewModel()
{
    _cvServices = new OpenCVService();

    AlgorithmList = new ObservableCollection<string>
    {
        "Threshold",
        "Otsu Threshold",
        "Adaptive Threshold",
        "Histogram"
    };
}

private void CreateParametersForAlgorithm(string algoName)
{
    // 선택된 이름에 따라 적절한 설정 클래스 생성
    switch (algoName)
    {
        case "Threshold":
            // 이진화 설정을 담을 그릇을 새로 만듭니다. (기본값 128 등 포함)
            CurrentParameters = new ThresholdParams();
            break;

        case "Adaptive Threshold":
            CurrentParameters = new AdaptiveThresholdParams();
            break;

        case "Otsu Threshold":
            // Otsu는 별도 설정이 필요 없으므로 null
            CurrentParameters = new OtsuParams();
            break;

        case "Histogram":
            CurrentParameters = new HistogramParams();
            break;

        default:
            CurrentParameters = null; // 설정이 필요 없는 경우
            break;
    }
}


private async void ApplyAlgorithm(object obj)
{
    if (string.IsNullOrEmpty(SelectedAlgorithm)) return;
    if (IsBusy) return; // 작업 중 중복 실행 방지

    try
    {
        IsBusy = true;
        AnalysisResult = "Processing...";

        // 비동기 처리 호출
        string result = await _cvServices.ProcessImageAsync(SelectedAlgorithm, CurrentParameters);

        if (result == "This Image is Gray Image.")
        {
            MessageBox.Show("Gray 영상입니다.", "Gray Image", MessageBoxButton.OK);
        }

        AnalysisResult = result;
        ShowOriginal = false;
        UpdateDisplay();

        // 히스토그램 알고리즘의 경우, 팝업 윈도우 표시
        if(SelectedAlgorithm == "Histogram" && _cvServices.LastHistogramData != null)
        {
            HistogramWindow histWin = new HistogramWindow(_cvServices.LastHistogramData, _cvServices.LastHistogramChannel);
            histWin.Owner = Application.Current.MainWindow; // 부모 창 설정
            histWin.Show();
        }
    }
    catch (Exception ex)
    {
        AnalysisResult = "처리 중 에러: " + ex.Message;
    }
    finally
    {
        IsBusy = false;
    }
}
// MainWindow.xaml
<!-- Histogram 템플릿 -->
<DataTemplate DataType="{x:Type local:HistogramParams}">
<StackPanel>
<TextBlock Text="Histogram Settings" Margin="0,0,0,5" FontWeight="Bold"/>
<TextBlock Text="Channel (Color)" Margin="0,5,0,0"/>
<ComboBox ItemsSource="{Binding ChannelSource}" SelectedItem="{Binding Channel}" Margin="0,2,0,0" Height="25"/>
<TextBlock Text="Mask Mode" Margin="0,5,0,0"/>
<ComboBox ItemsSource="{Binding MaskModeSource}" SelectedItem="{Binding MaskMode}" Margin="0,2,0,0" Height="25"/>
<TextBlock Text="Hist Size (Bins)" Margin="0,5,0,0"/>
<Grid>
<Grid.ColumnDefinitions>
<ColumnDefinition Width="*"/>
<ColumnDefinition Width="50"/>
</Grid.ColumnDefinitions>
<Slider Grid.Column="0" Minimum="1" Maximum="256" Value="{Binding HistSize}" VerticalAlignment="Center" />
<TextBox Grid.Column="1" Text="{Binding HistSize}" Margin="5,0,0,0" TextAlignment="Center" />
</Grid>
<TextBlock Text="Range (Min - Max)" Margin="0,5,0,0"/>
<Grid Margin="0,2,0,0">
<Grid.ColumnDefinitions>
<ColumnDefinition Width="*"/>
<ColumnDefinition Width="10"/>
<ColumnDefinition Width="*"/>
</Grid.ColumnDefinitions>
<TextBox Grid.Column="0" Text="{Binding RangeMin}" TextAlignment="Center"/>
<TextBlock Grid.Column="1" Text="~" HorizontalAlignment="Center" VerticalAlignment="Center"/>
<TextBox Grid.Column="2" Text="{Binding RangeMax}" TextAlignment="Center"/>
</Grid>
<TextBlock Text="* Apply 버튼을 누르면 팝업창이 뜹니다." Foreground="Blue" FontSize="11" Margin="0,10,0,0" TextWrapping="Wrap"/>
</StackPanel>
</DataTemplate>실행
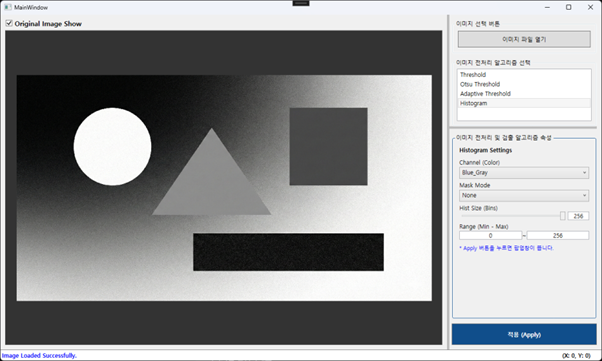
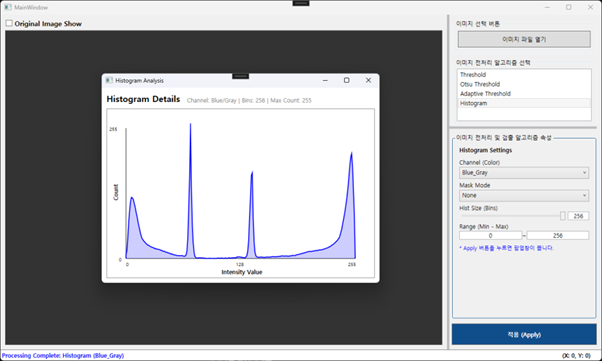
흠… 조금 길었습니다. 이제 빌드 후 실행해 볼까요? 이미지를 불러오고 Histogram 알고리즘을 선택한 뒤 [적용 (Apply)] 버튼을 눌러보세요. 아래의 이미지는 히스토그램 분석을 위해 로딩한 원본 이미지와 Default 파라미터로 적용하였을 때 Histogram 그래프를 나타내었습니다.
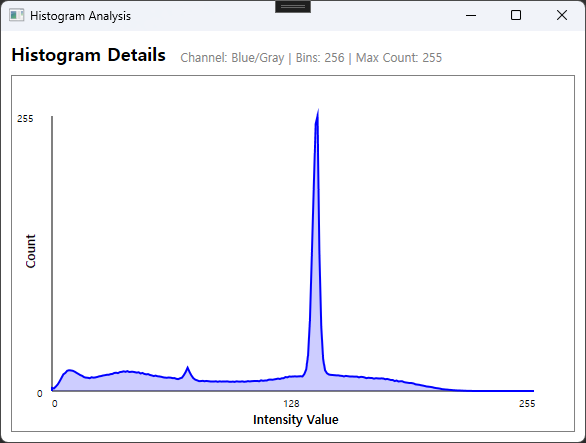
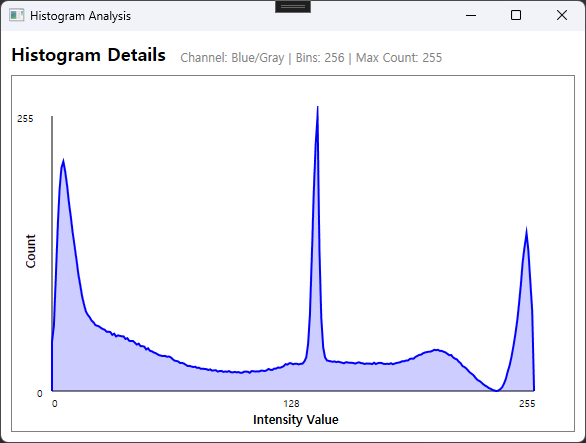
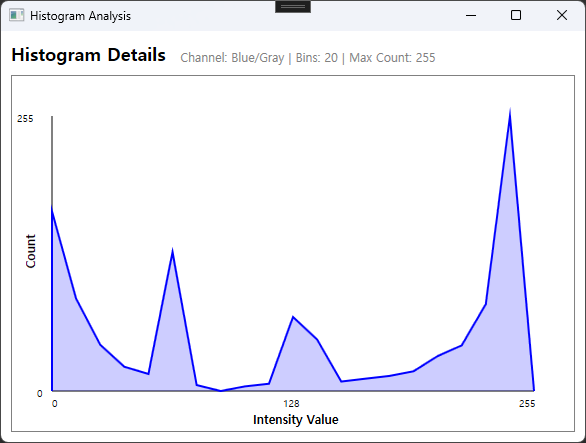
아래 이미지부터는 동일한 이미지에 대한 Histogram Analysis 윈도우만 갭쳐해서 올립니다.참고해 주세요. (일부 파라미터 조절 이미지만 올리니까, 각자 조정하면서 그래프를 분석해보세요)
이번 포스팅은 그래프 그리기 때문에 코드가 좀 길어졌습니다. 하지만 외부 차트 라이브러리 없이 순수 WPF 기능만으로 이렇게 깔끔한 분석 도구를 만들 수 있다는 점이 매력적이지 않나요?
다음 시간에는 이렇게 분석한 데이터를 바탕으로 이미지를 선명하게 만드는 정규화(Normalization)에 대해 다뤄보겠습니다. 다음 편은 아주 간단하니 걱정 마세요! ^^
참고 자료
OpenCV API: Cv2.CalcHist: OpenCV 공식 문서 (CalcHist) – 함수 파라미터 상세 설명.
WPF Graphics: Polyline Class: MS Docs (Polyline) – 점들을 연결하여 선을 그리는 WPF 도형 객체